BRIAN WANG
I'm a master's student at Stanford studying statistics. I'm currently working as a Marketing and Data Fellow for a charter school in Memphis through Education Pioneers.
I graduated from UCLA in 2014. Some of my interests include education, data visualization, and linear models. In my free time I enjoy music, reading, and trying out new places to eat.
SOCIAL MEDIA AND STUFF
PROJECTS
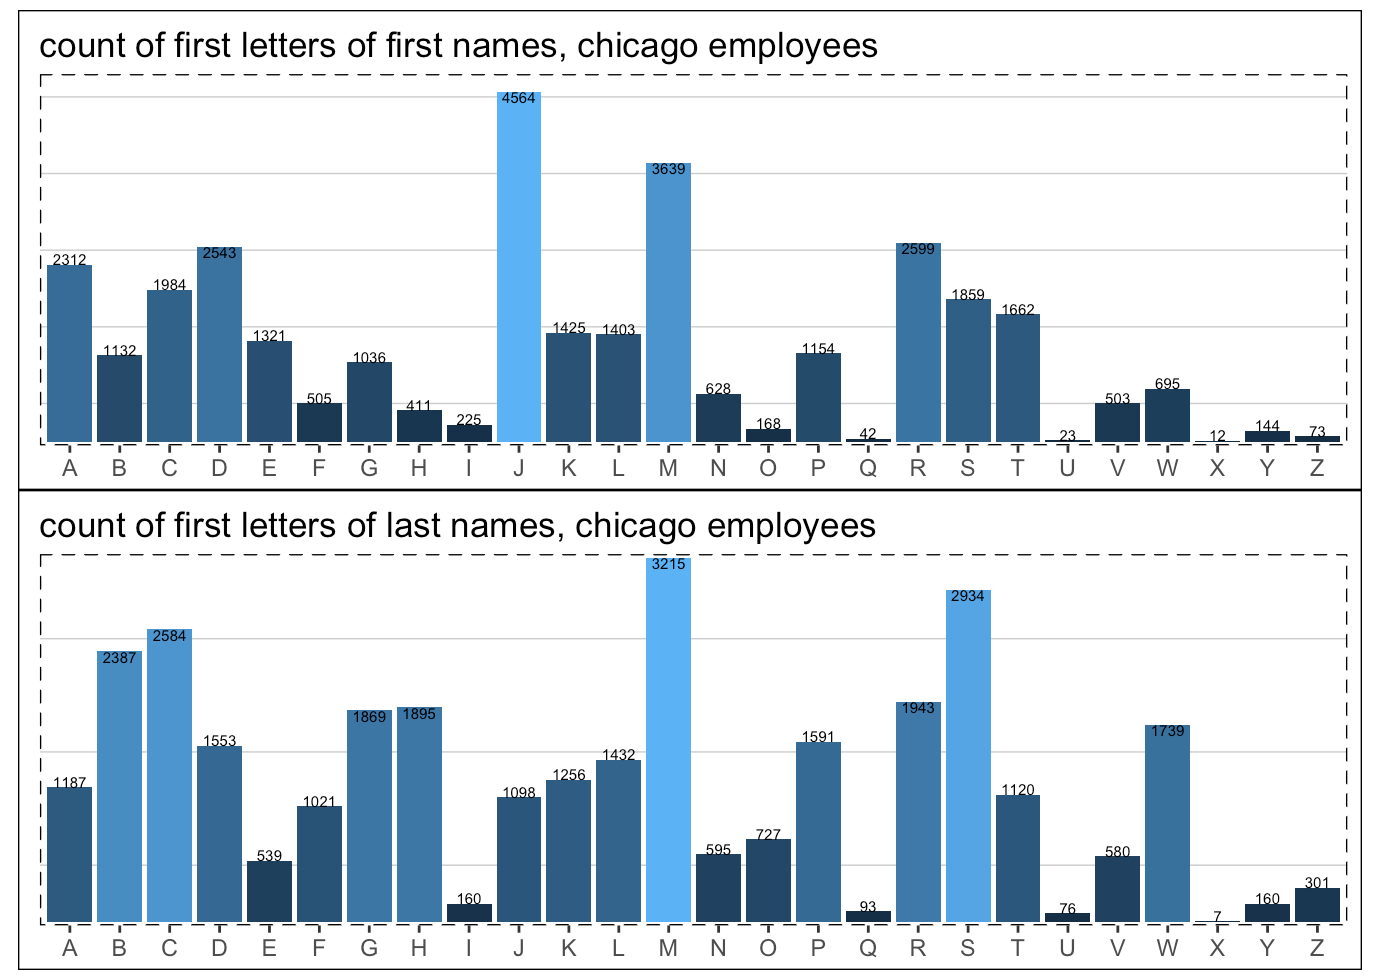
An Analysis of City of Chicago Employee Salaries
July 2017For this project, I analyzed a dataset on city of Chicago employee salaries, created some data visualizations and learned that there is a person in Chicago that earns an annual salary of $1. For real. It's a thing.

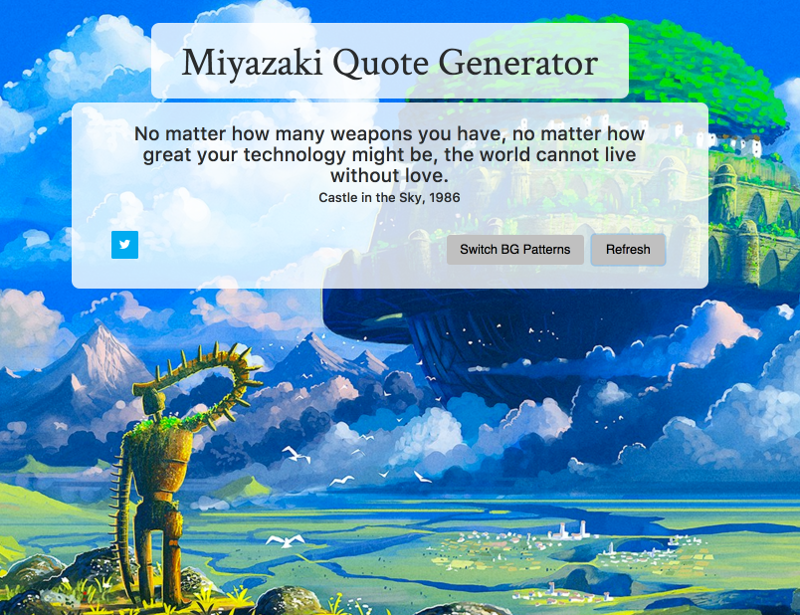
Miyazaki Quote Generator
July 2017For this project, we used d3 to create an interactive scatterplot. This project was part of a class at Stanford, CME151A: Interactive Visualization using d3.

The Merger of Memphis City and Shelby County Schools
July 2017I was in Memphis this summer and found myself interested in understanding the politics of the MCS-SCS merger, where the Memphis City and Shelby County Districts merged and six suburban municipalities subsequently broke off to form their own districts.

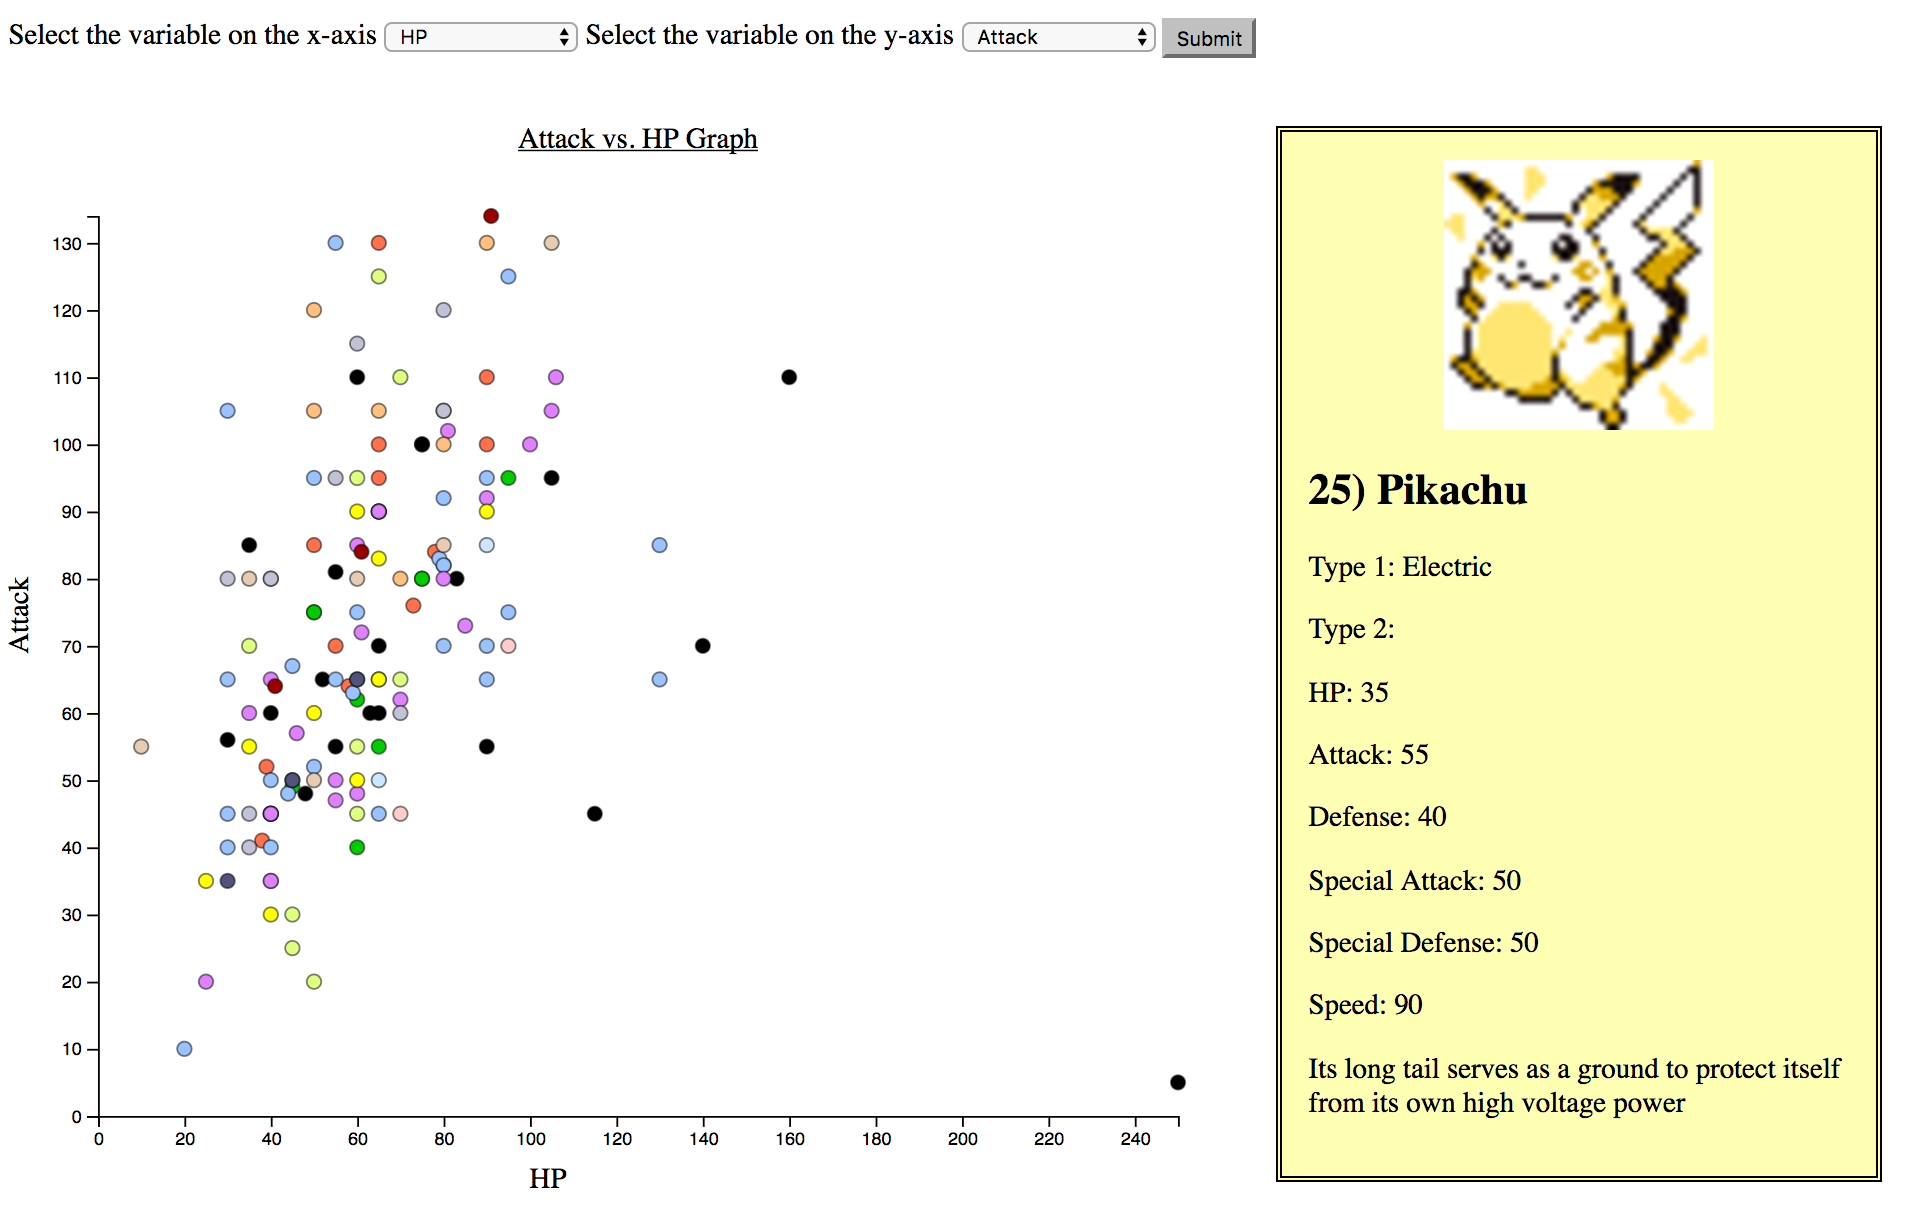
Visualization of Pokemon Attributes using d3.js
May 2017For this project, we used d3 to create an interactive scatterplot. This project was part of a class at Stanford, CME151A: Interactive Visualization using d3.

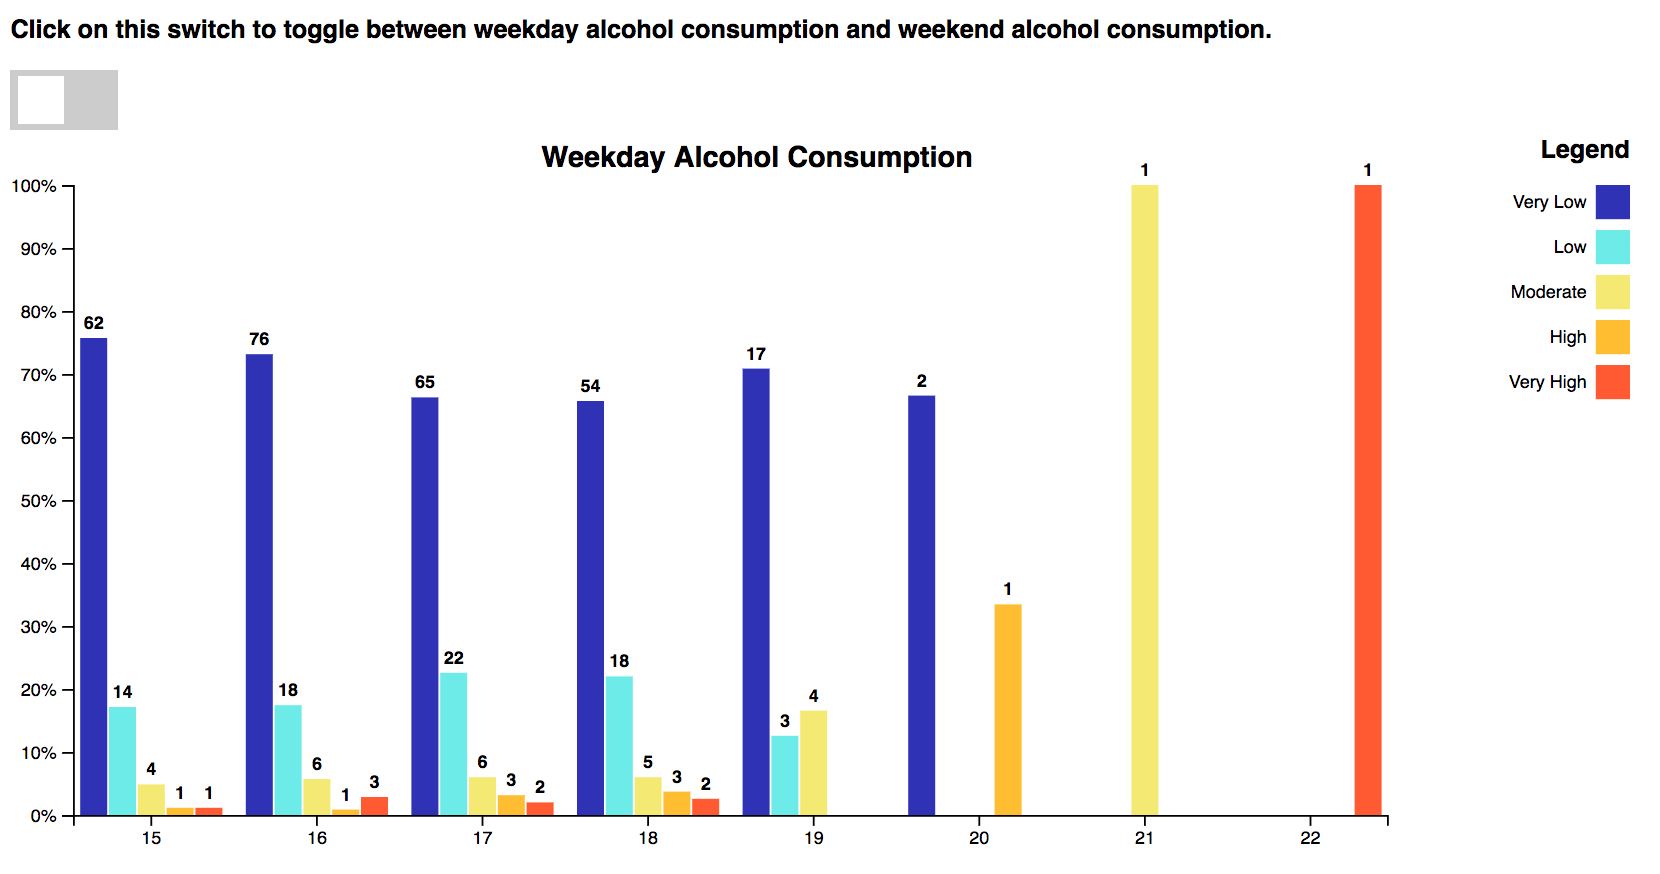
Visualization of Student Alcohol Consumption
April 2017For this project, I used d3 to create an interactive barplot. This project was part of a class at Stanford, CME151A: Interactive Visualization using d3.

FUN STUFF
Well, this is me trying to use Bootstrap. I'm going to leave this section open and blank
in case I decide to add another section in. But for now, I'll link to this favorite video of mine of the Scottie Pinwheel! (Cute video of puppies!!)
Click here: https://www.youtube.com/watch?v=vDa0z0gEvI4
CONTACT ME
- e-mail: bwang16@stanford.edu
- phone: (626) 347-3944
This website was made on a July afternoon by me, using CSS Bootstrap and a lot of trial and error. No coffee, surprisingly! Last updated Monday, July 17, 2017.
I'm a Hufflepuff.