About me
Hello! I'm currently a master's student at Stanford studying statistics, and you've stumbled across my portfolio page. I'm currently working as a Marketing and Data Fellow for a charter school in Memphis through Education Pioneers. This is where you can find some examples of the work I've done, as well as other personal projects and random things.
I graduated from UCLA in 2014. Some of my interests include education, data visualization, and linear models. In my free time I enjoy music, reading, and trying out new places to eat.
About the design
The starfield design of this page arose a bit inadvertently. I was experimenting with jQuery and Javascript, trying to see what I was able to do with it graphically, and I ended up creating a starfield with a (sort-of) parallax effect, which was a lot cooler (to me) than what I was setting out for.
The starfall effect is created with d3. I think it's pretty neat.
PROJECTS
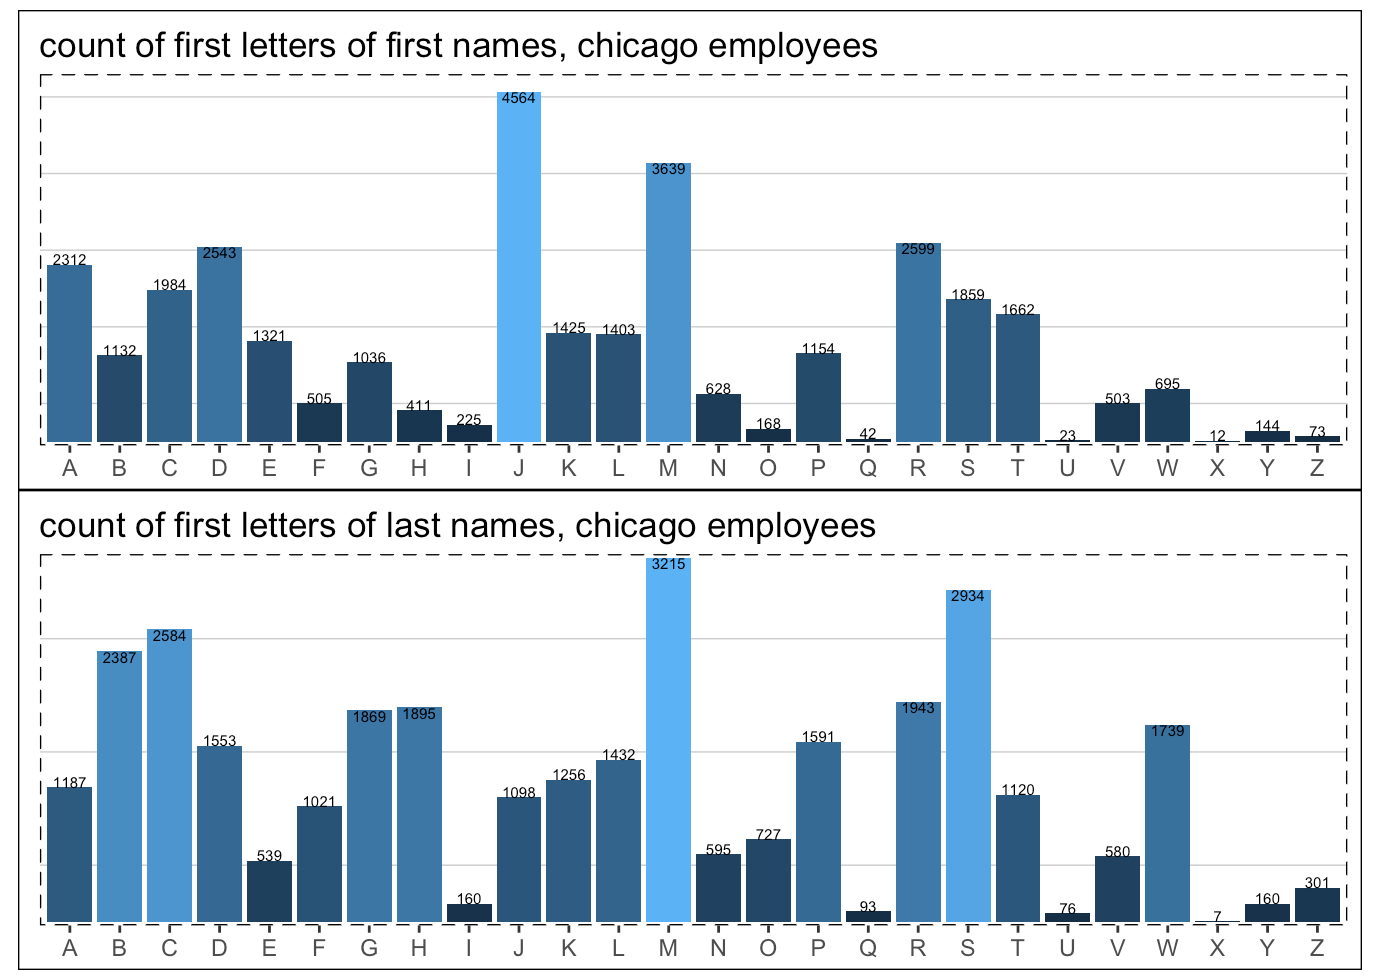
An Analysis of City of Chicago Employee Salaries
July 2017For this project, I analyzed a dataset on city of Chicago employee salaries, created some data visualizations and learned that there is a person in Chicago that earns an annual salary of $1. For real. It's a thing.
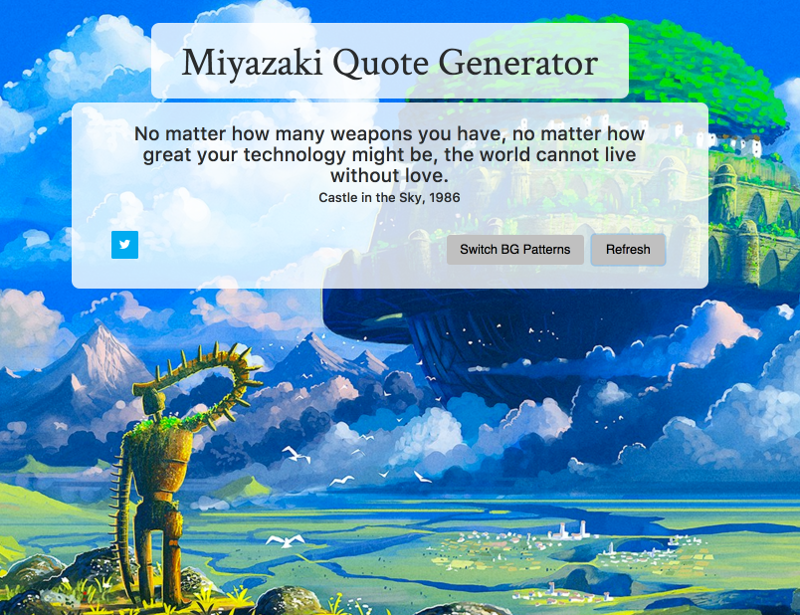
Miyazaki Quote Generator
July 2017For this project, we used d3 to create an interactive scatterplot. This project was part of a class at Stanford, CME151A: Interactive Visualization using d3.
The Merger of Memphis City and Shelby County Schools
July 2017I was in Memphis this summer and found myself interested in understanding the politics of the MCS-SCS merger, where the Memphis City and Shelby County Districts merged and six suburban municipalities subsequently broke off to form their own districts.
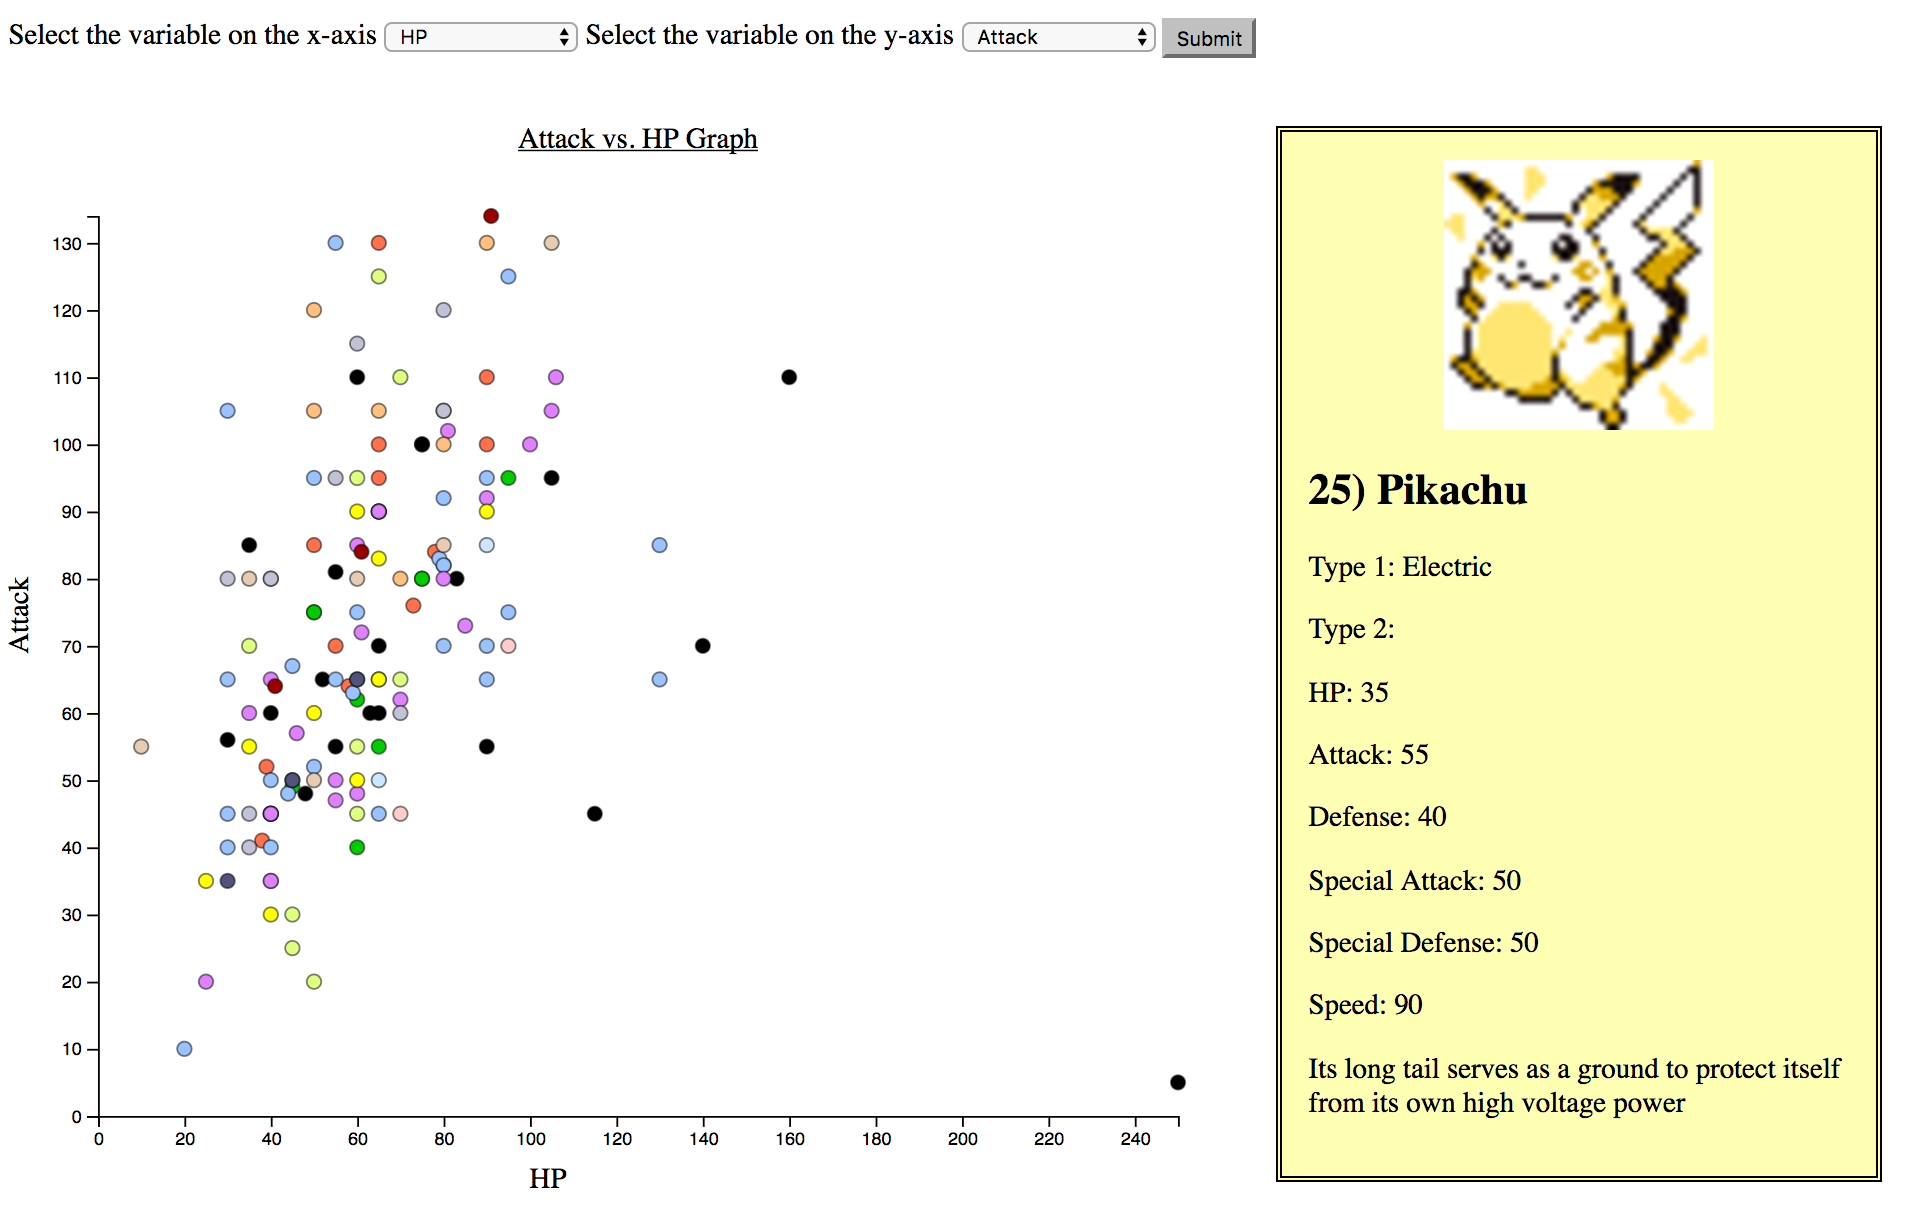
Visualization of Pokemon Attributes using d3.js
May 2017For this project, we used d3 to create an interactive scatterplot. This project was part of a class at Stanford, CME151A: Interactive Visualization using d3.
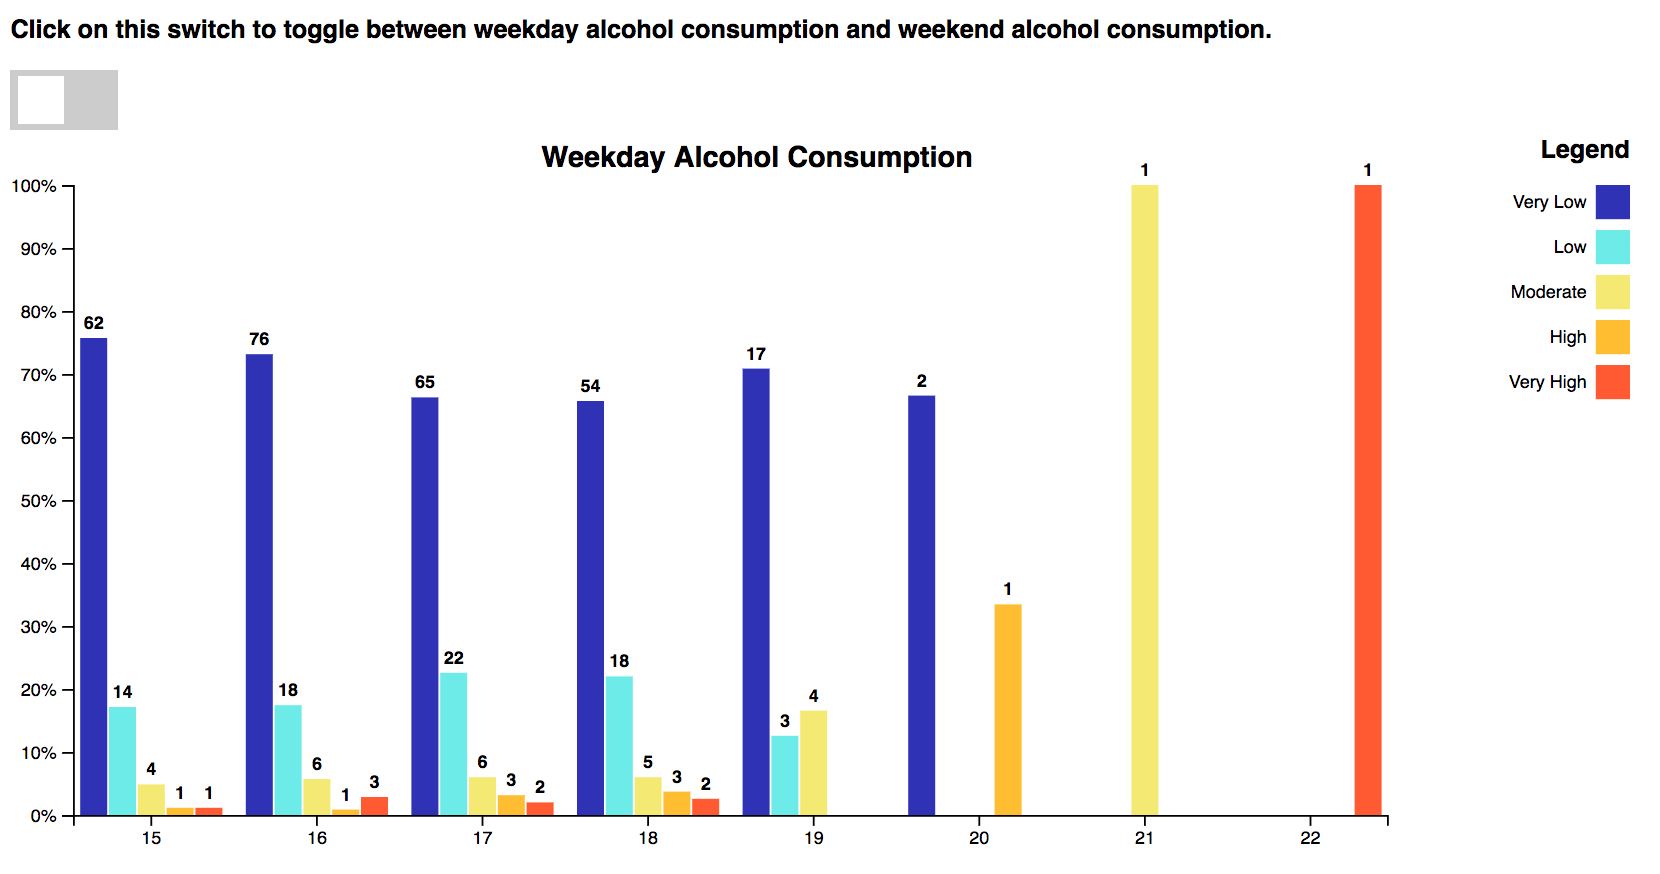
Visualization of Student Alcohol Consumption
April 2017For this project, I used d3 to create an interactive barplot. This project was part of a class at Stanford, CME151A: Interactive Visualization using d3.
Time traveler
This is a fun section I keep here mainly just for me (but also for you!), where you can access older versions of this webpage. Click on these links to see how this website has changed over time as I've updated the design and added content.
Contact me
- E-mail: bwang16(at)stanford(dot)edu
- House: Hufflepuff (send me an owl!)